Your monthly mortgage payment including the principal and interest is the largest component of home ownership. Often the taxes on the property are the second highest cost of home-ownership and is greatly impacting homeowners.
In Connecticut the effective real-estate property tax rate is 1.97%, the state median home value is $270,500.00, and the annual taxes on homes priced at the state median value is $5,327.00.
What Happened to Rates Last Week?
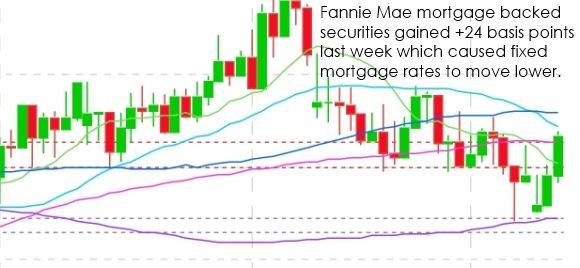
Mortgage backed securities gained +24 basis points from last Friday’s close which caused fixed mortgage rates to move slightly lower from the prior week.
OVERVIEW: We had a holiday shortened week. Overall, the limited economic data that hit the markets showed was fairly strong but Friday’ Consumer Price Index showed that core prices (ex the volatile food and energy categories) rose at only 1.7% which is well below the Fed’s target inflation rate of 2.0%. This pushed MBS to their highest levels of the week which means that we saw the lowest mortgage rates of the week right after that report.
Inflation? The Core (ex-food and energy) CPI for September matched the same pace as August which was 1.7%. The market was expecting a slight increase to 1.8%. The headline CPI hit 2.2% which was a good increase from August’s pace of 1.9%. But the bottom line is that the core number is still well below 2% which is favorable to bonds.
Retail Sales: Showed some very solid gains with the ex-Autos number jumping by 1.0% vs est of only 0.3%. However, much of the spike is contributed to buying supplies, etc due to rebuilding from the hurricanes. Headline Retail Sales which includes Autos increased by 1.6% vs est of 1.7%, a slight miss but a big pick up from August’s pace of -0.1%. Consumer Sentiment: Wow! The September data never really showed any type of dip due to the hurricanes and now the preliminary October data is off the charts with a triple digit reading of 101.1 which is the highest readings in 10 years.
Jobs, Jobs, Jobs: The August Job Openings and Labor Turnover Survey (JOLTS) showed a very large amount of unfilled jobs just waiting for skilled workers and hit 6.082M which is a very slight pullback from July’s level of 6.140M but still just below historic highs. This basically means that the labor market will continue to tighten with an Unemployment Rate of only 4.2%, we have a tremendous amount of open jobs and the only way to fill them will be to pilfer employees from a competitor…and in the process pay up to get them to make the switch.
What to Watch Out For This Week
- NY Empire Manufacturing Index
- Industrial Production (MoM)
- Capacity Utilization
- NAHB Housing Market Index
- Housing Starts Building Permits
- Fed’s Beige Book
- Philadelphia Fed Manufacturing Survey
- Initial Jobless Claims, Continuing Jobless Claims
- Leading Economic Indicators
- Existing Home Sales (MoM)
I will be watching these reports closely for you and let you know if there are any big surprises.
